

This page is also available in Arabic.
What it does
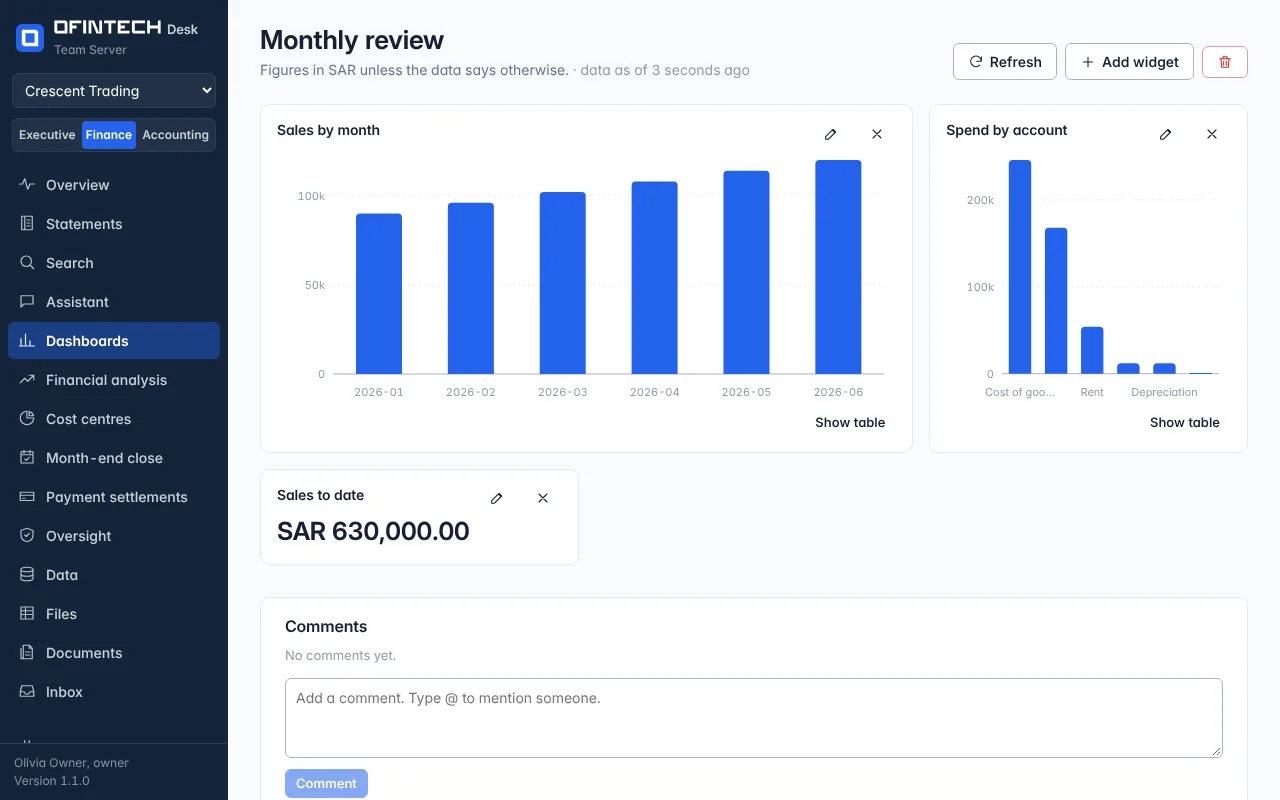
A dashboard is a set of widgets — single figures, bars, lines, stacked bars, areas, tables — each a query over a dataset under Data. The figures are recalculated from the latest data on demand, and the page says what data they were last recalculated from.
Why it is there
The numbers a team watches weekly are rarely the statements. They are sales by region, spend by account, a count of open items. Dashboards let those be built once from the data you already have, without a spreadsheet that goes stale.
When to open it
- Weekly, for the figures the team agreed to watch
- After a sync or a new import, with recalculate from the latest data
- When the assistant has built one for you and you want to adjust a widget
How it works
Start from a blank dashboard, from a template (the P&L, receivables and payables templates need a dataset synced from an accounting connection), or ask the assistant: add a chart of expenses by month. Each widget has a title, a type and a query — the dataset, what to measure, what to group by, what to filter.
A scenario
A sales lead wants revenue by month and spend by account on one screen. Two widgets over the imported ledger, grouped by month and by account, and a single figure for sales to date. The dashboard is ready before the meeting; after the next import, one click recalculates it.
Steps
Create a dashboard
New dashboard: blank, from a template, or ask the assistant.
Add a widget
Choose a dataset, a measure, a grouping and a chart type.
Recalculate
After new data, recalculate from the latest data or fetch it from the connection first.
Questions
Why is the template greyed out?
The P&L, receivables and payables templates read a dataset synced from an accounting connection. Connect one under Connections, or build the dashboard over an imported file.